Quick User Guide
Overview
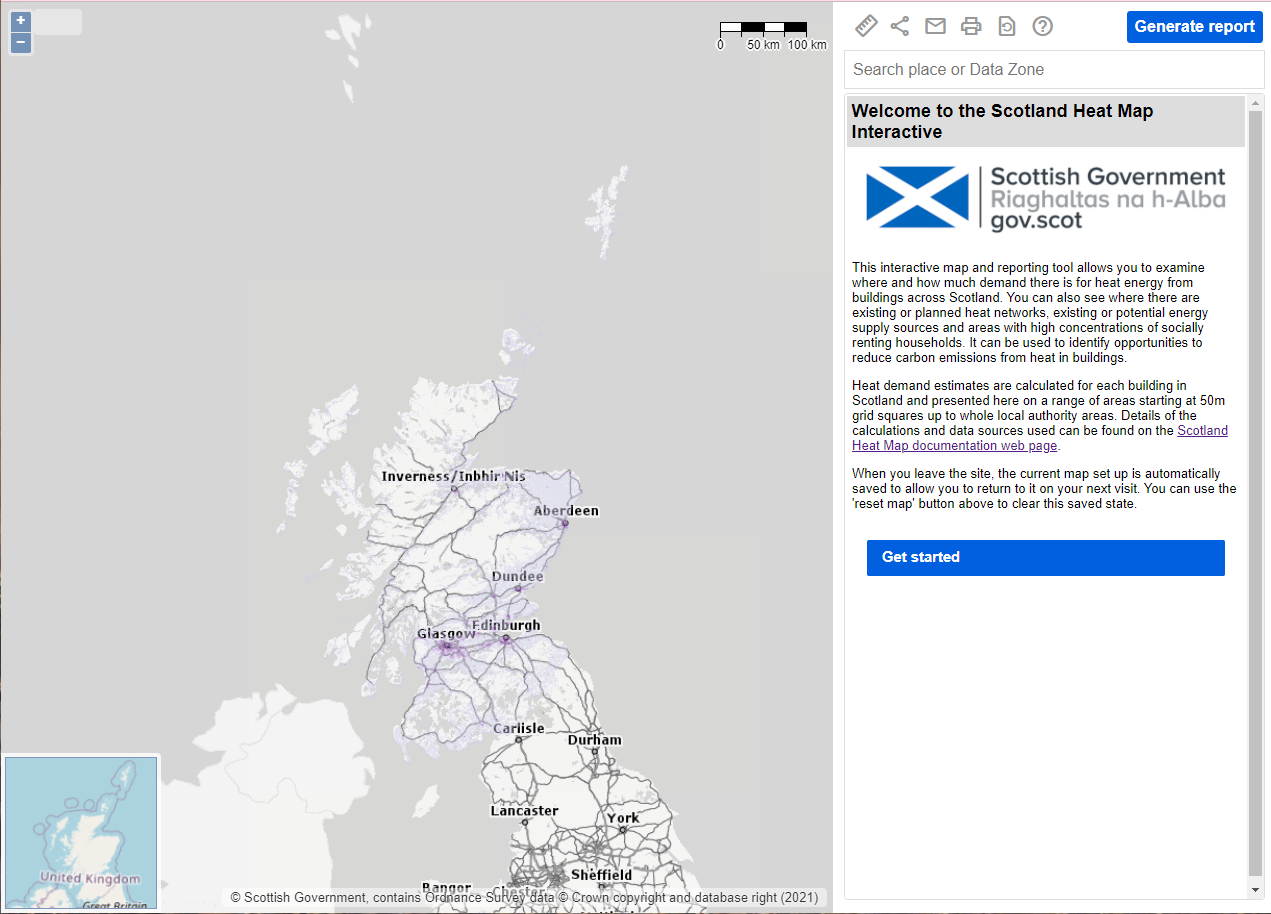
This document outlines the main features and uses of Scotland Heat Map. Click on Get started to begin and you will see the different map layers you can select to view on the map and report on.
Searching
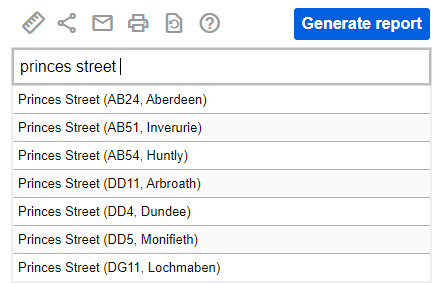
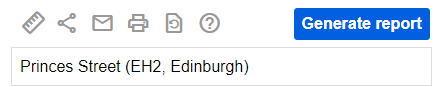
You first step would normally be to position the map to the area you are interested in and one of the ways to do this is to use the Search box at the top right of the map, to search for a place or Data Zone. As you start to type matching addresses will be displayed e.g.
Navigating the Map

Another way to position the map is to zoom in or out. You can use the scroll bar on your mouse or click on the plus (zoom in) or minus (zoom out) buttons on the Navigation Toolbar at the top left of the map.
You may also see a left arrow (Navigate back) and right arrow (Navigate forward) if you have previously panned or zoomed the map.
You can also hold down the shift key and draw a rectangle on the map (marquee select), and when you release the mouse the map will zoom to that specific area. If you just want to move the map to a different location you can click and hold the left mouse button (pan) to drag the map into a different location. There is an Overview Map in the bottom left hand corner so that you can see where your chosen area resides. There is also a indication of the scale of the map in the top right hand corner.
Base Mapping
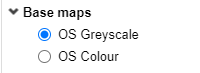
Base mapping is always displayed and you can choose if you wish to see this as OS Greyscale or OS Colour by selecting the relevant Base maps entry at the bottom of the Legend e.g.
Note: Radio buttons (circular) allow you to select a single entry whilst Check boxes (square) allow you to select multiple entries.
Map Layers
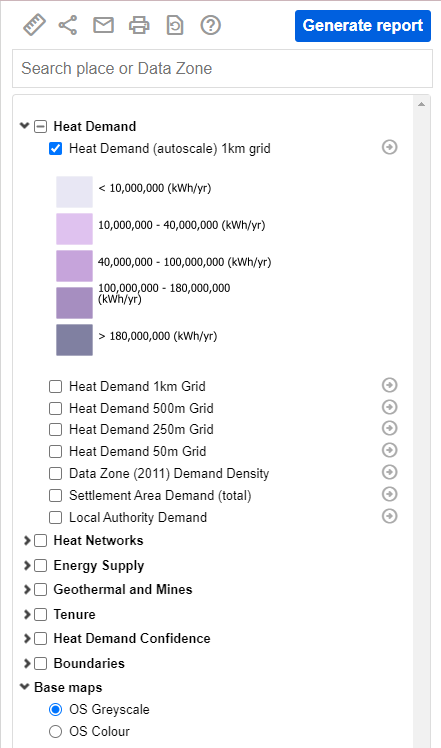
Now you can decide which other information you are interested in by ticking the relevant boxes in the Legend. If you tick the box for the heading entry then its layers can be displayed on the map. You can select a single layer or mutiple layers in different layer groups. We have selected to display ‘Settlement Area Demand (total)’ e.g.
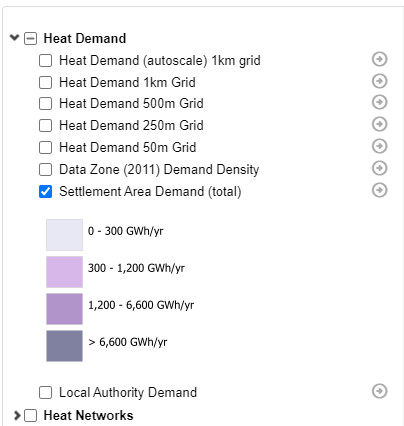
Once an entry has been selected a small image is displayed in the Legend detailing how each layer will be displayed on the map. Note: To remove a layer from the map just untick the box in the Legend.
Clicking on the right arrow to the right of a Layer in the Legend will display more information about the Layer e.g.
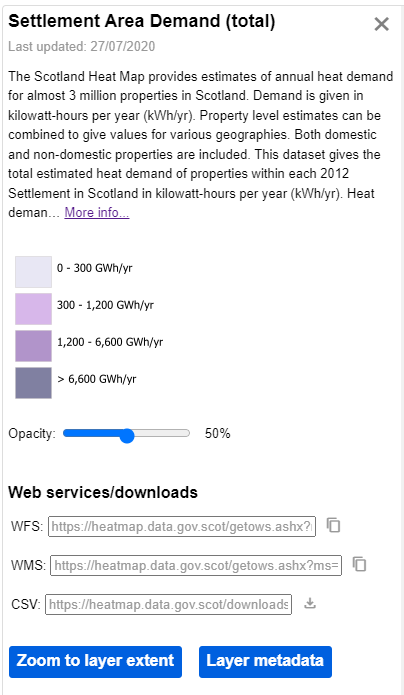
Here you will also find buttons to Zoom to layer extent which zooms the map to the extents of the chosen layer and Layer metadata which displays the ScotGov metadata for the Layer; as well as allowing you to change the Opacity of the Layer, links to WFS, WMS Web Services and CSV download. Simply click the X at the top right beside the Layer name to close the Layer details.
To find out more information about a particular entry just click on it on the map and an Information box will appear e.g.
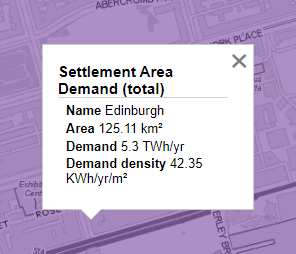
Again, clicking the X at the top right will close the window.
Generating a Heat Demand Report
First select the Area and Layers you are interested in using the tools described above and then click on the Generate report button above the Search box.
This displays the Heat Demand Report where you can choose how to draw / select the area of interest for your report e.g.
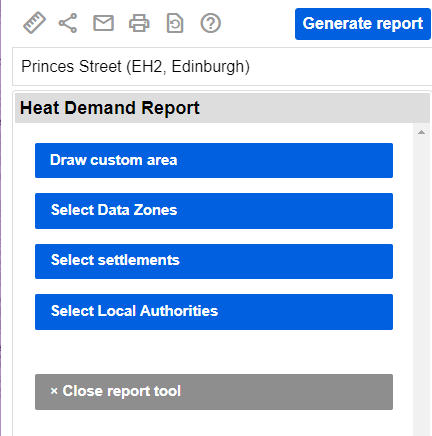
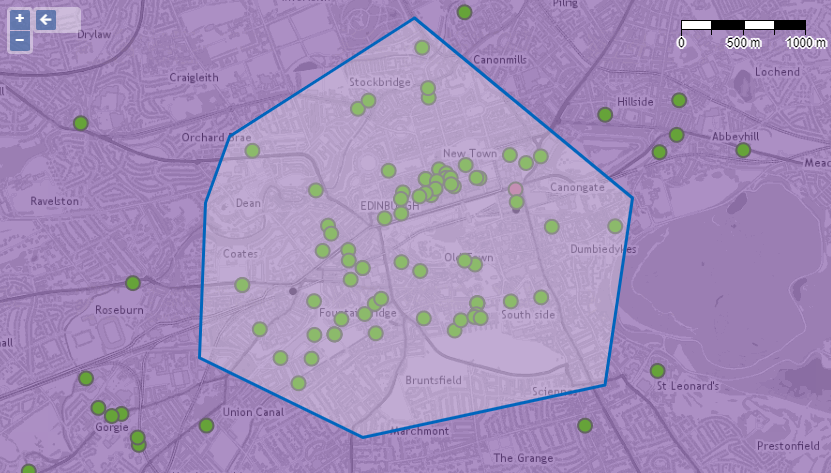
Decide how to create your area of interest either by drawing a custom area (click Draw Custom Area) or selecting from the various predefined geographies such as Data Zones, Settlements or Local Authorities by clicking the relevant button. If you select Draw custom area you then draw an area on the map by clicking to add points to create an area and the double click to finish e.g.
If you select any of the predefined geographies then simply click to select the geography you are interested in; you may select more than one. As you select an area it is outlined on the map and the details displayed in the Heat Demand Report area e.g.
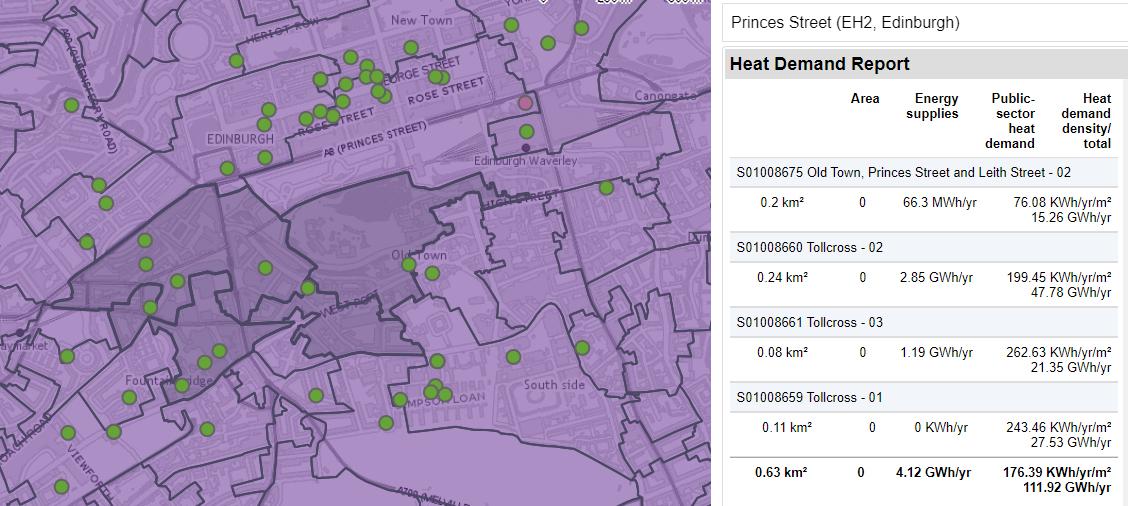
Once you are happy with your choices you have the option to either Print report, which will create a PDF of the data, including the map, or Download CSV which creates a CSV file of the details. The information included within the report includes the Area, Energy supplies, Public-sector head demand and Total heat demand for each area.
You can reset your area of interest by clicking Reset report area and return to the Legend by clicking Close report tool.
Other Tools

There are some other tools which you may find useful which can be accessed by clicking on the relevant button.
Just hover over each tool to find out what it does e.g. Measure, link, print, reset map and help.